Add a "Visualizers and Overrides" concept page #6679
There are no files selected for viewing
This file contains bidirectional Unicode text that may be interpreted or compiled differently than what appears below. To review, open the file in an editor that reveals hidden Unicode characters.
Learn more about bidirectional Unicode characters
| Original file line number | Diff line number | Diff line change |
|---|---|---|
| @@ -0,0 +1,111 @@ | ||
| --- | ||
| title: Visualizer and Overrides | ||
| order: 650 | ||
| --- | ||
|
|
||
| This section explains the process by which logged data is used to produce a visualization and how it can be customized via the user interface or code. | ||
|
|
||
| *Note*: this area is under heavy development and subject to changes in future releases. | ||
|
|
||
| ## How are visualizations produced? | ||
|
|
||
| [](https://postimg.cc/47xZ2M3m) | ||
|
|
||
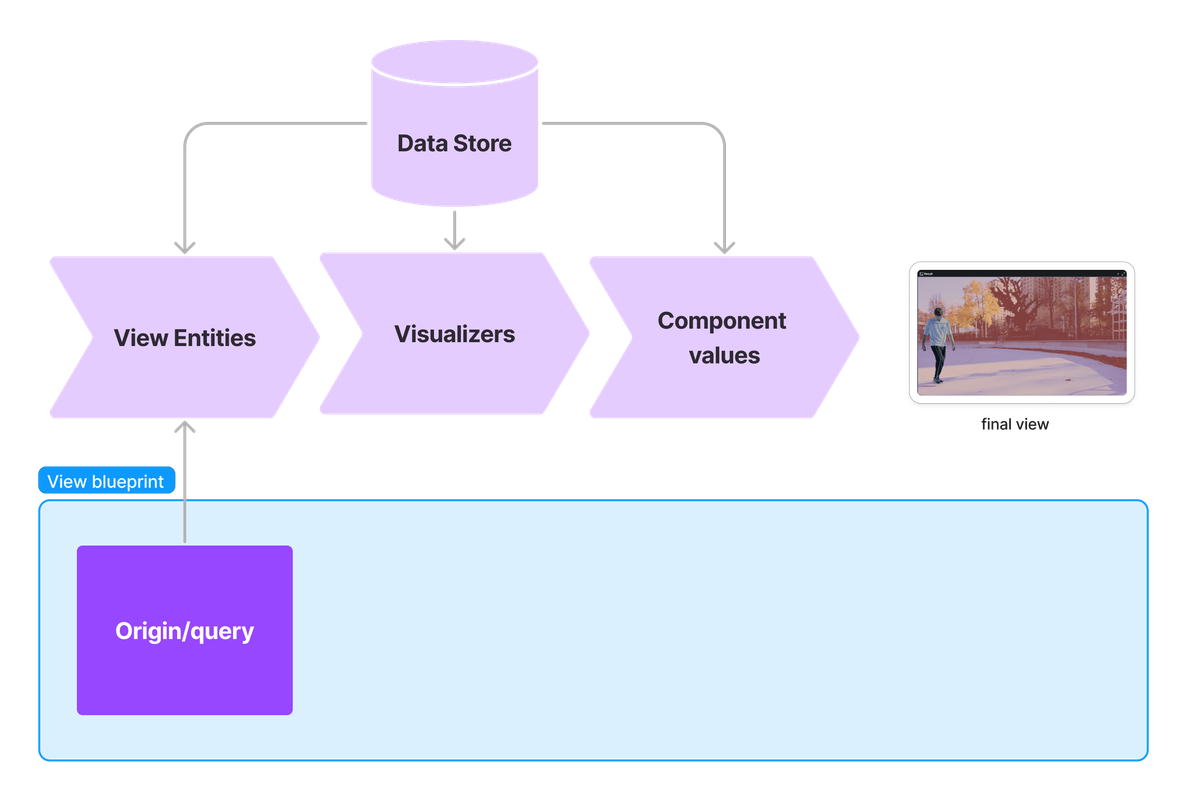
| In the Rerun viewer, visualizations happen within _views_, which are defined by their [_blueprint_](blueprint.md). | ||
|
|
||
| The first step for a view to display its content is to determine which entities are involved. This is determined | ||
| by the [entity query](../reference/entity-queries.md), which is part of the view blueprint. The query is run against the data store to generate the list of view entities. | ||
|
|
||
| Views rely on visualizers to display each of their entities. For example, [3D views](../reference/types/views/spatial3d_view.md) use the `Points3D` visualizer to display 3D point clouds, and [time series views](../reference/types/views/time_series_view.md) use the `SeriesLine` visualizer to display time series line plots. Which visualizers are available is highly dependent on the specific kind of view. For example, the `SeriesLine` visualizer only exist for time series views—not, e.g., 3D views. | ||
|
|
||
| For a given view, visualizers are selected for each of its entities based on their content. For example, in a 3D view, an entity containing a [`Position3D`](../reference/types/components/position3d.md) results in a `Points3D` visualizer being selected by default. (We will see that the visualizer selection process can be influenced by both the user interface and the blueprints.) | ||
|
There was a problem hiding this comment. This is slightly incorrect. If an entity contains Position3D component it is compatible with the Points3D visualizer. To be compatible with Visualizer, an entity must have all of the required components. The thing that makes it selected by default is the Points3DIndicator component that is also logged when you use the Points3D archetype. If you just log Position3DBatch without the Points3D archetype, then you will have to instantiate the visualizer manually. There was a problem hiding this comment. Thanks. I wasn't sure if we had this strong indicator<->visualiser relationship in place already. |
||
|
|
||
| Then, each selected visualizer determines the values for the components it supports. For example, the `Points3D` visualizer handles, among others, the [`Position3D`](../reference/types/components/position3d.md), [`Radius`](../reference/types/components/radius.md), and [`Color`](../reference/types/components/color.md) components. For each of these (and the others it also supports), the visualizer must determine a value. By default, it will use the value that was logged to the data store, if any. Otherwise, it will use some fallback value that | ||
| depends on the actual type of visualizer and view. (Again, we will see that this can be influenced by the user interface and the blueprint.) | ||
abey79 marked this conversation as resolved.
Show resolved
Hide resolved
|
||
|
|
||
| For an illustration, let's consider a simple example with just two [`Boxes2D`](../reference/types/archetypes/boxes2d.md): | ||
|
|
||
| snippet: concepts/viscomp-base | ||
|
|
||
| Here is how the user interface represents the `Boxes2D` visualizers in the selection panel, when the corresponding entity is selected: | ||
|
|
||
| <img width="50%" src="https://i.postimg.cc/L6gKRBt2/image.png"> | ||
|
|
||
|
|
||
| All components used by the visualizer are represented, along with their corresponding values as determined by the visualizer. For the [`Color`](../reference/types/components/color.md) component, we can see both the store and fallback values, the former taking precedence over the latter. | ||
|
|
||
|
|
||
|
|
||
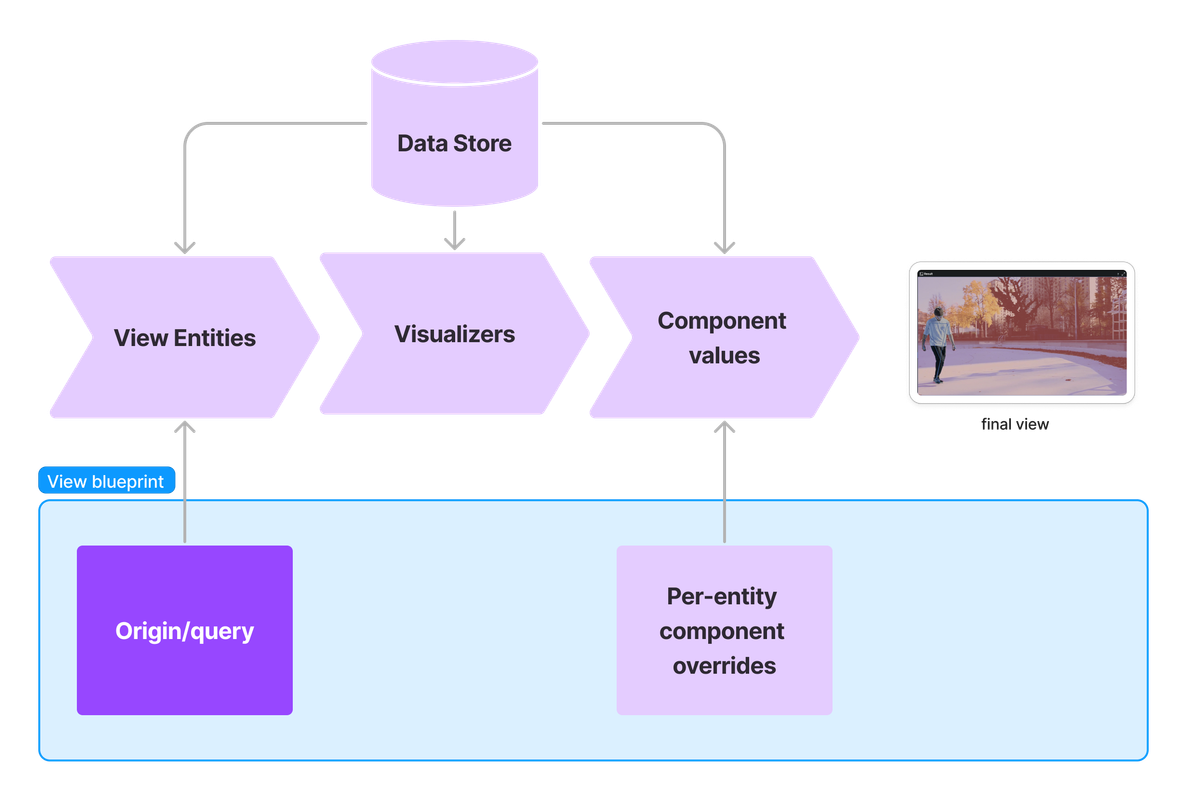
| ## Per-entity component override | ||
|
|
||
| [](https://postimg.cc/f3fZWsPH) | ||
|
|
||
| To customize a visualization, the blueprint may override any component value for any view entity. This can be achieved either from the user interface or the logging SDK. When such an override is defined, it takes precedence over any value that might have been logged to the data store. | ||
|
|
||
| This is how it is achieved with the blueprint API: | ||
|
|
||
| snippet: concepts/viscomp-component-override | ||
|
|
||
| The color of `/boxes/1` is overridden to green. Here is how the user interface represents the corresponding visualizer: | ||
|
|
||
| <img width="50%" src="https://i.postimg.cc/zBXDktyT/image.png"> | ||
|
|
||
| The override is listed above the store and fallback value since it has precedence. It can also be edited or removed from the user interface. | ||
|
|
||
|
|
||
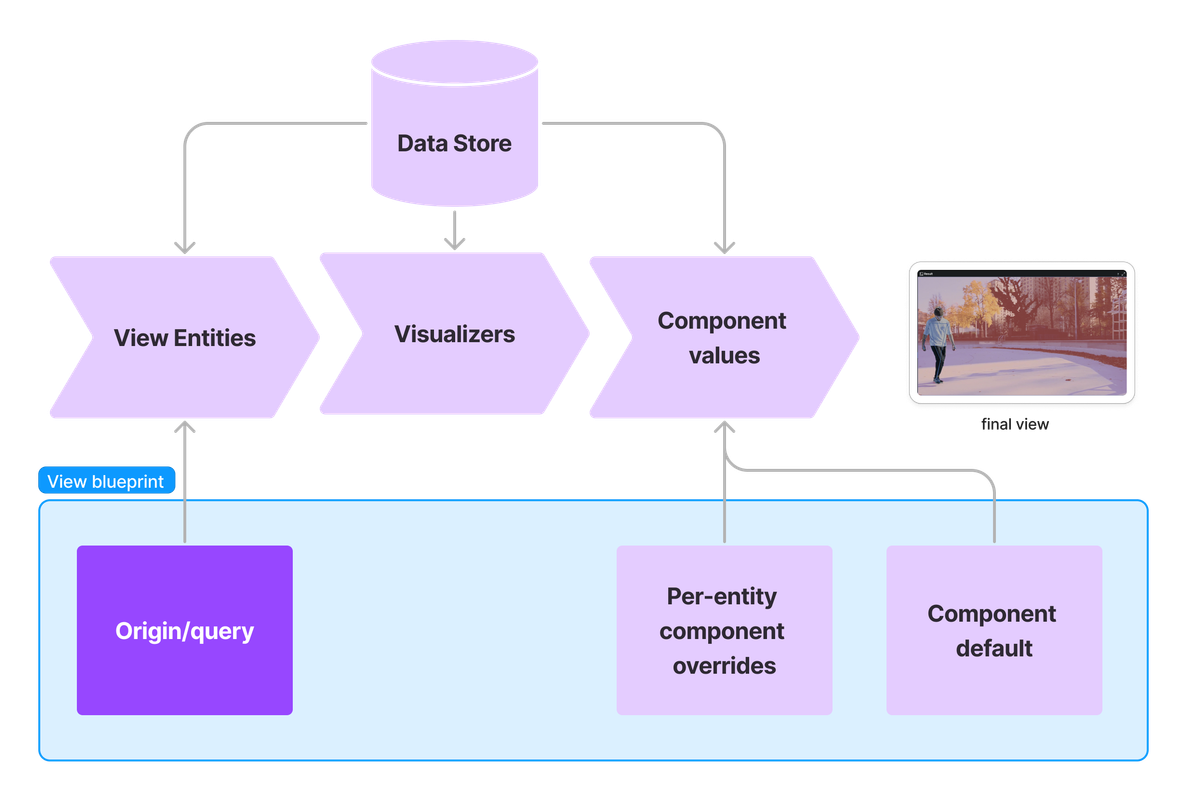
| ## Per-view component default | ||
|
|
||
| [](https://postimg.cc/tnC0Dm92) | ||
|
|
||
| The blueprint may also specify a default value for all components of a given type, should their value not be logged to the store or overridden for a given view entity. This makes it easy to configure visual properties for a potentially large number of entities a view may contain. | ||
|
|
||
| This is how it is achieved with the blueprint API: | ||
|
|
||
| snippet: concepts/viscomp-component-default | ||
|
|
||
| Here, the `/boxes/2` entity is no longer logged with a color value, but a default color is added to the blueprint. Here is how the user interface represents its visualizer: | ||
|
|
||
| <img width="50%" src="https://i.postimg.cc/pLbs53Sc/image.png"> | ||
|
|
||
| The default color value is displayed above the fallback since it takes precedence. It can also be edited or removed from the user interface. | ||
|
|
||
| All component default values are displayed in the selection panel when selecting the corresponding view: | ||
|
|
||
| <img src='https://i.postimg.cc/pX8gSQb7/image.png' width="50%" alt='image'/> | ||
|
|
||
| Again, it is possible to manually add, edit, and remove component defaults from the user interface. | ||
|
|
||
|
|
||
| ## Component value resolution order | ||
|
|
||
| The previous sections showed that visualizers use a variety of sources to determine the values of the components they are interested in. Here is a summary of the priority order: | ||
|
|
||
| 1. **Override**: the per-entity override (the highest priority) | ||
| 2. **Store**: the value that was logged to the data store (e.g., with the `rr.log()` API) | ||
| 3. **Default**: the default value for this component type | ||
| 4. **Fallback**: a context-specific fallback value which may depend on the specific visualizer and view type (the lowest priority) | ||
|
|
||
| As an illustration, all four values are available for the `/boxes/1` entity of the previous example. Here is how its visualizer is represented in the user interface: | ||
|
|
||
| <img src="https://i.postimg.cc/W4K8jK07/image.png" width="50%"> | ||
|
|
||
|
|
||
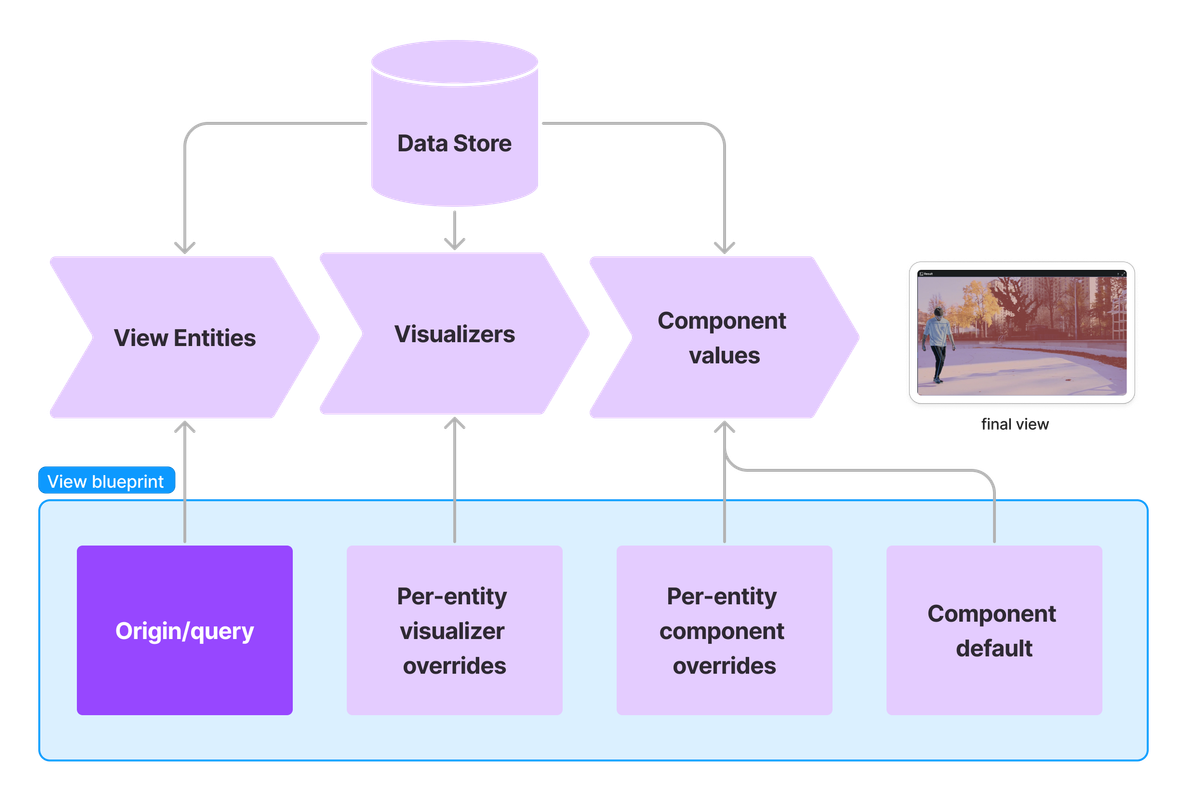
| ## Visualizer override | ||
|
|
||
| So far, we discussed how visualizers determine values for the components they are interested in and how this can be customized. This section instead discusses the process of how visualizers themselves are determined and how to override this process. | ||
|
|
||
| ⚠️NOTE: the feature covered by this section, including its API, is very likely to change in future releases. TODO: link to GH issue. | ||
|
|
||
| [](https://postimg.cc/SYdJn5K4) | ||
|
|
||
| In the previous examples, because [`Boxes2D`](../reference/types/archetypes/boxes2d.md) archetypes were used for logging then entities, `Boxes2D` visualizers were automatically selected. A key factor driving this behavior is the `Boxes2DIndicator` component, which is a data-less marker automatically inserted by the corresponding `Boxes2D` archetype. This is, however, not the only visualizer capable of displaying these entities. The `Point2D` visualizer can also be used, since it only requires [`Position2D`](../reference/types/components/position2d.md) components. | ||
|
|
||
| Here is how to force a `Points2D` visualizer for `/boxes/1`, instead of the default `Boxes2D` visualizer: | ||
|
|
||
| snippet: concepts/viscomp-visualizer-override | ||
|
|
||
| The view now displays a point instead of the box. Here is how the visualizer is displayed in the user interface (note the visualizer of type `Points2D`): | ||
|
|
||
| <img src="https://i.postimg.cc/V6k3d2h0/image.png" width="50%"> | ||
|
|
||
| It is possible to add and remove visualizers from the user interface. It is also possible to have multiple visualizers for the same view entity. For example, if both a `Points2D` and `Boxes2D` visualizers are defined in this example, both a box and a point will be displayed. | ||
This file contains bidirectional Unicode text that may be interpreted or compiled differently than what appears below. To review, open the file in an editor that reveals hidden Unicode characters.
Learn more about bidirectional Unicode characters
| Original file line number | Diff line number | Diff line change |
|---|---|---|
| @@ -0,0 +1,12 @@ | ||
| """Base example.""" | ||
|
|
||
| import rerun as rr | ||
| import rerun.blueprint as rrb | ||
|
|
||
| rr.init("rerun_example_component_override", spawn=True) | ||
|
|
||
| # Data logged to the data store. | ||
| rr.log("boxes/1", rr.Boxes2D(centers=[0, 0], sizes=[1, 1], colors=[255, 0, 0])) | ||
| rr.log("boxes/2", rr.Boxes2D(centers=[2, 0], sizes=[1, 1], colors=[255, 0, 0])) | ||
|
|
||
| rr.send_blueprint(rrb.Spatial2DView()) |
This file contains bidirectional Unicode text that may be interpreted or compiled differently than what appears below. To review, open the file in an editor that reveals hidden Unicode characters.
Learn more about bidirectional Unicode characters
| Original file line number | Diff line number | Diff line change |
|---|---|---|
| @@ -0,0 +1,22 @@ | ||
| """Add a component default.""" | ||
|
|
||
| import rerun as rr | ||
| import rerun.blueprint as rrb | ||
|
|
||
| rr.init("rerun_example_component_override", spawn=True) | ||
|
|
||
| # Data logged to the data store. | ||
| rr.log("boxes/1", rr.Boxes2D(centers=[0, 0], sizes=[1, 1], colors=[255, 0, 0])) | ||
| rr.log("boxes/2", rr.Boxes2D(centers=[2, 0], sizes=[1, 1])) | ||
|
|
||
| rr.send_blueprint( | ||
| rrb.Spatial2DView( | ||
| overrides={ | ||
| "boxes/1": [ | ||
| rr.components.Color([0, 255, 0]), | ||
| ] | ||
| }, | ||
| # Add a default value for all Color components in this view | ||
| defaults=[rr.components.Color([0, 0, 255])], | ||
| ), | ||
| ) |
This file contains bidirectional Unicode text that may be interpreted or compiled differently than what appears below. To review, open the file in an editor that reveals hidden Unicode characters.
Learn more about bidirectional Unicode characters
| Original file line number | Diff line number | Diff line change |
|---|---|---|
| @@ -0,0 +1,21 @@ | ||
| """Override a component.""" | ||
|
|
||
| import rerun as rr | ||
| import rerun.blueprint as rrb | ||
|
|
||
| rr.init("rerun_example_component_override", spawn=True) | ||
|
|
||
| # Data logged to the data store. | ||
| rr.log("boxes/1", rr.Boxes2D(centers=[0, 0], sizes=[1, 1], colors=[255, 0, 0])) | ||
| rr.log("boxes/2", rr.Boxes2D(centers=[2, 0], sizes=[1, 1], colors=[255, 0, 0])) | ||
|
|
||
| rr.send_blueprint( | ||
| rrb.Spatial2DView( | ||
| # Override the values from the data store for the first box. | ||
| overrides={ | ||
| "boxes/1": [ | ||
| rr.components.Color([0, 255, 0]), | ||
| ] | ||
| }, | ||
| ), | ||
| ) |
This file contains bidirectional Unicode text that may be interpreted or compiled differently than what appears below. To review, open the file in an editor that reveals hidden Unicode characters.
Learn more about bidirectional Unicode characters
| Original file line number | Diff line number | Diff line change |
|---|---|---|
| @@ -0,0 +1,23 @@ | ||
| """Override a visualizer.""" | ||
|
|
||
| import rerun as rr | ||
| import rerun.blueprint as rrb | ||
|
|
||
| rr.init("rerun_example_component_override", spawn=True) | ||
|
|
||
| # Data logged to the data store. | ||
| rr.log("boxes/1", rr.Boxes2D(centers=[0, 0], sizes=[1, 1], colors=[255, 0, 0])) | ||
| rr.log("boxes/2", rr.Boxes2D(centers=[2, 0], sizes=[1, 1])) | ||
|
|
||
| rr.send_blueprint( | ||
| rrb.Spatial2DView( | ||
| overrides={ | ||
| "boxes/1": [ | ||
| # Specify which visualizer(s) to use. | ||
| rrb.VisualizerOverrides(rrb.visualizers.Points2D), | ||
abey79 marked this conversation as resolved.
Show resolved
Hide resolved
|
||
| rr.components.Color([0, 255, 0]), | ||
| ] | ||
| }, | ||
| defaults=[rr.components.Color([0, 0, 255])], | ||
| ), | ||
| ) | ||
This file contains bidirectional Unicode text that may be interpreted or compiled differently than what appears below. To review, open the file in an editor that reveals hidden Unicode characters.
Learn more about bidirectional Unicode characters
Oops, something went wrong.
Add this suggestion to a batch that can be applied as a single commit.
This suggestion is invalid because no changes were made to the code.
Suggestions cannot be applied while the pull request is closed.
Suggestions cannot be applied while viewing a subset of changes.
Only one suggestion per line can be applied in a batch.
Add this suggestion to a batch that can be applied as a single commit.
Applying suggestions on deleted lines is not supported.
You must change the existing code in this line in order to create a valid suggestion.
Outdated suggestions cannot be applied.
This suggestion has been applied or marked resolved.
Suggestions cannot be applied from pending reviews.
Suggestions cannot be applied on multi-line comments.
Suggestions cannot be applied while the pull request is queued to merge.
Suggestion cannot be applied right now. Please check back later.
There was a problem hiding this comment.
Choose a reason for hiding this comment
The reason will be displayed to describe this comment to others. Learn more.
There was a problem hiding this comment.
Choose a reason for hiding this comment
The reason will be displayed to describe this comment to others. Learn more.
This is actually a em-dash (not visible with monospace font) and I exploit the lack of style guide to decide that we dont use spaces around it :) A cursory look indicates that I'm mostly the only one to actually use them, so I'm not infringing on some untold consistency rule 😅
Here is how it looks IRL (I'm taking that "for" in):

There was a problem hiding this comment.
Choose a reason for hiding this comment
The reason will be displayed to describe this comment to others. Learn more.
Background: https://www.merriam-webster.com/grammar/em-dash-en-dash-how-to-use (last paragraph covers spacing)
There was a problem hiding this comment.
Choose a reason for hiding this comment
The reason will be displayed to describe this comment to others. Learn more.
🤯