Profiling your code with Flamegraph is simple.
In Jupyter notebooks, click the 🔥 button above the cell you want to profile:

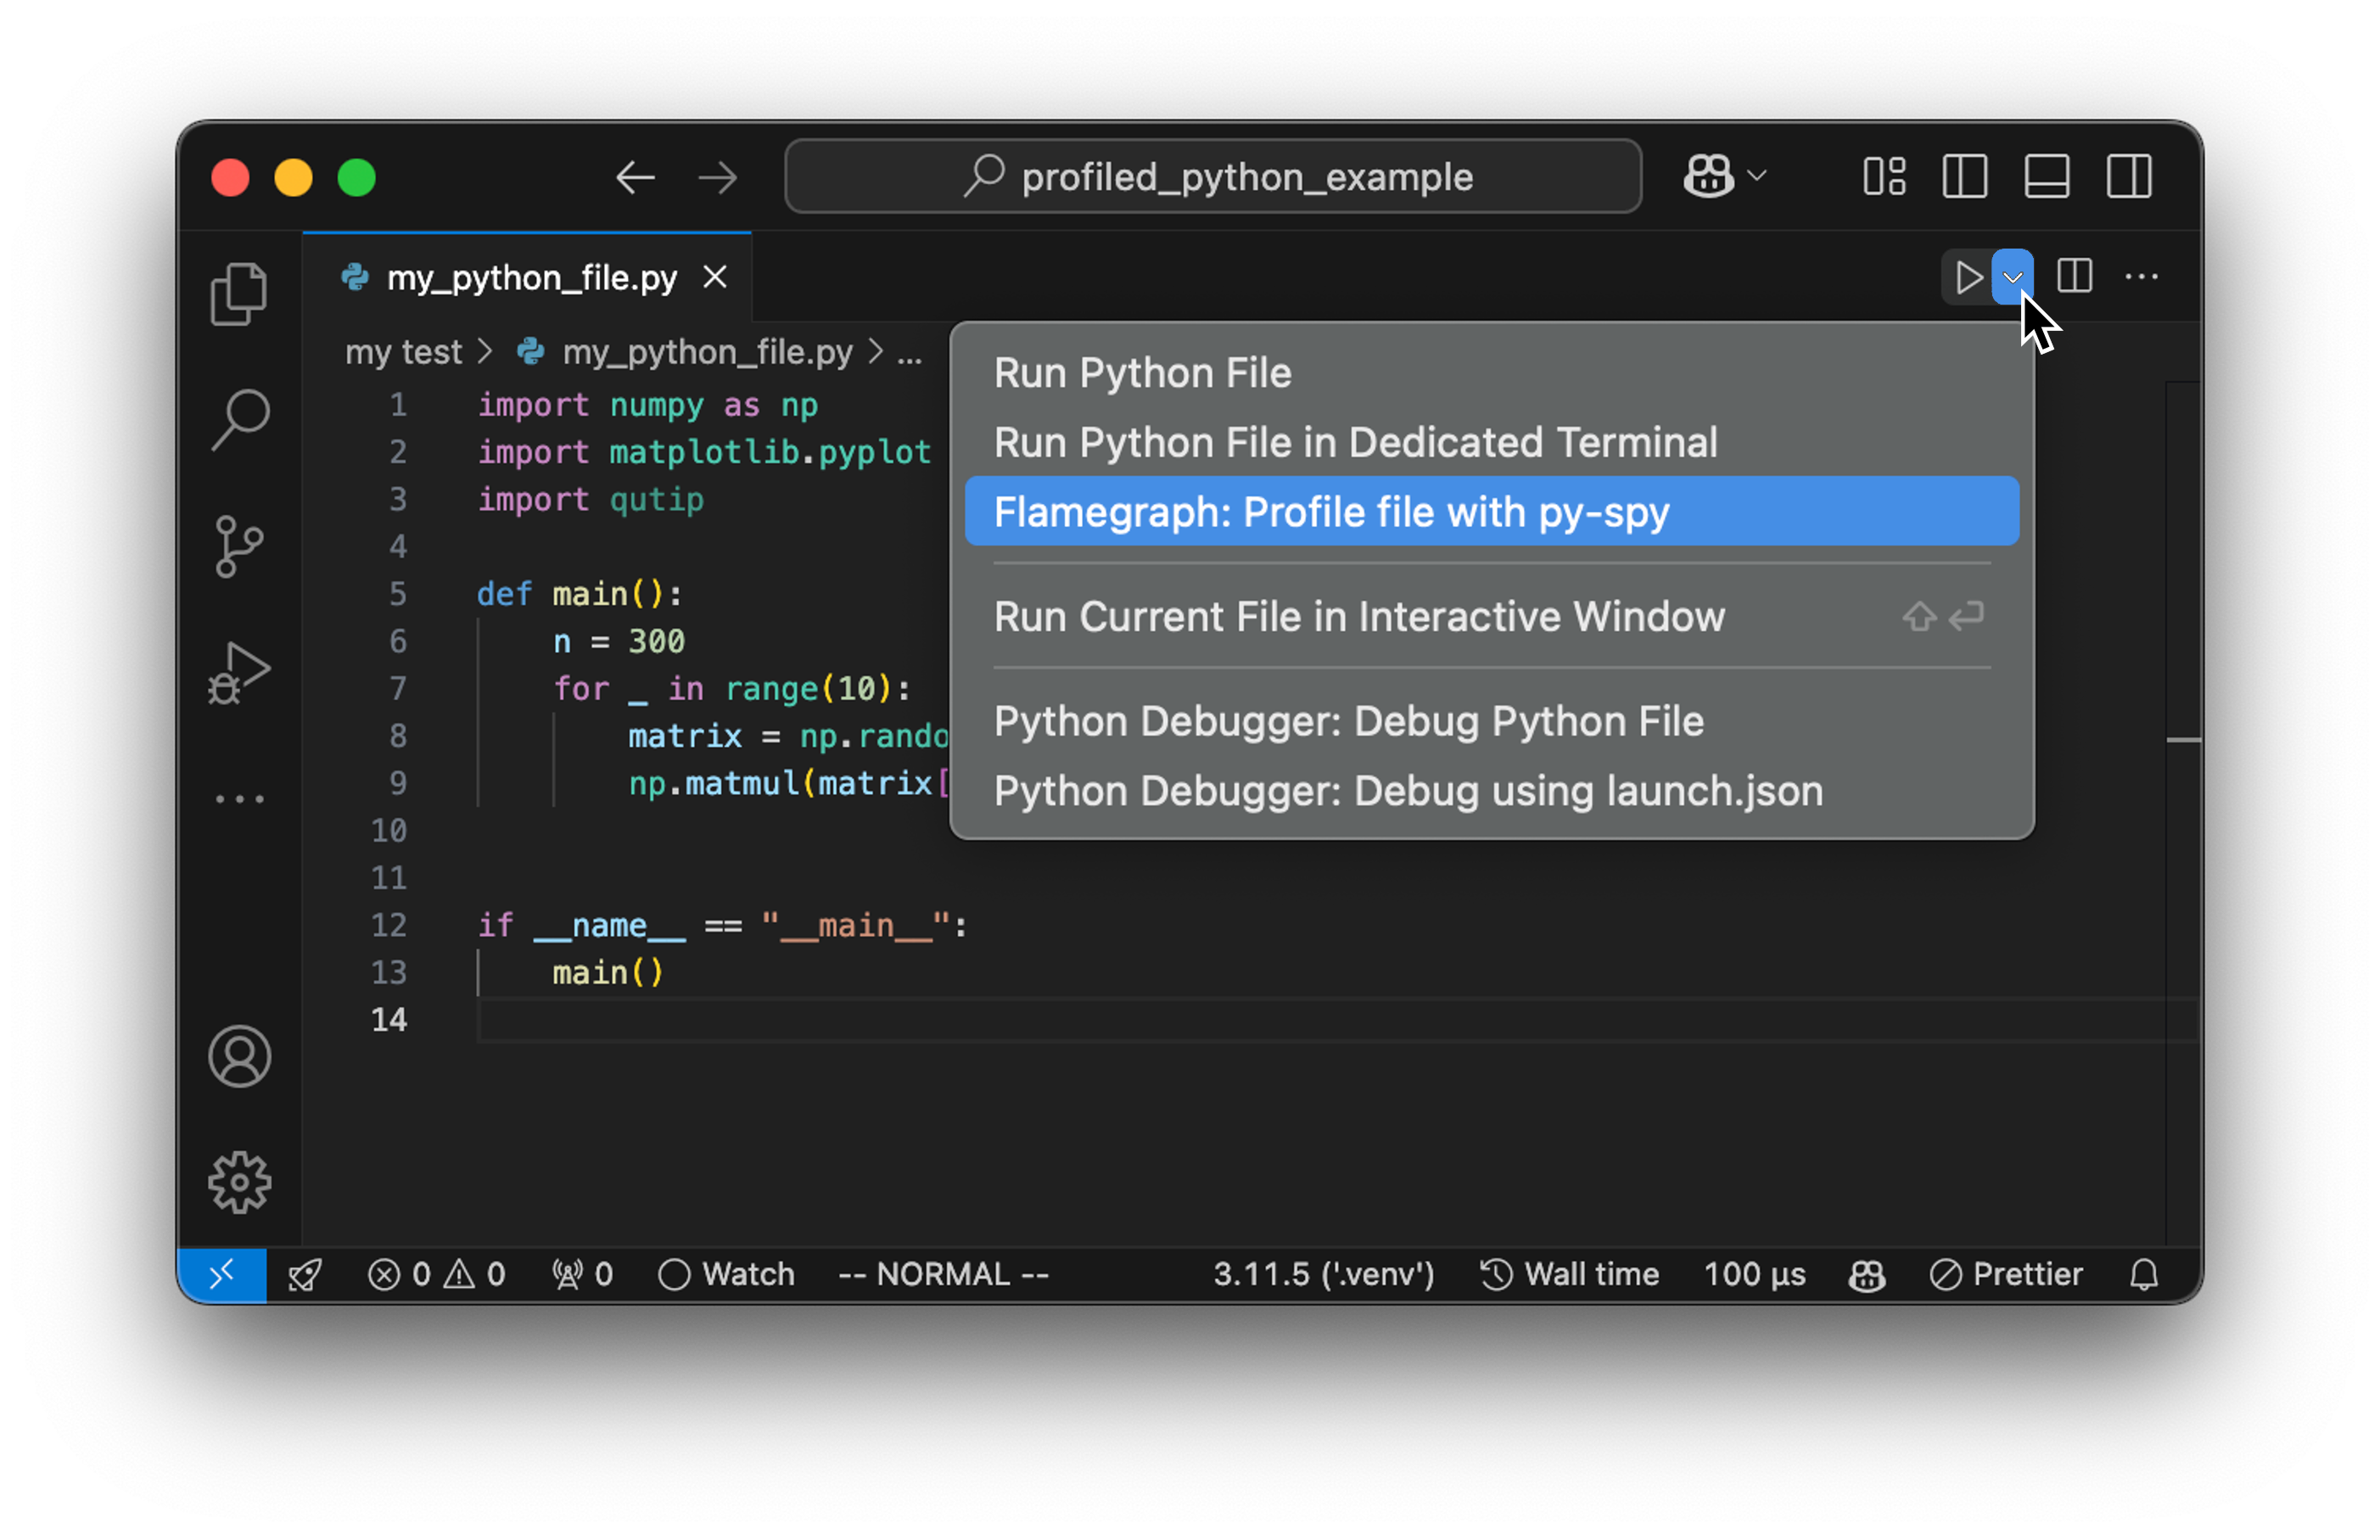
For Python scripts, select Flamegraph: Profile file with py-spy from the dropdown menu next to the
Your code will be profiled with py-spy. You can interrupt the profiling anytime via Ctrl+C
or wait for it to finish.
The profiling results are then visualized next to your code and as a flamegraph in a new tab.
To hide the inline annotions, right-click anywhere in the editor and select Flamegraph: Toggle Inline Profile.
The extension visualizes profiling data in two ways:
-
Inline Code Annotations: Shows timing information for each function scope, with colors indicating the scope level.
-
Interactive Flamegraph: Displays the complete call stack of your profiled code (see this article about flamegraphs). You can:
- Click any element to zoom in
- Click parent elements to zoom out
Cmd+Click(Mac) orCtrl+Click(Windows/Linux) any element to jump directly to that code.
The flamegraph and inline annotations are linked - when you select an element in the flamegraph, the corresponding inline annotations are filtered.

Open the Command Palette (Command+Shift+P on Mac and Ctrl+Shift+P on Windows/Linux) and type in one of the following commands:
| Command | Description |
|---|---|
Flamegraph: Profile file with py-spy |
Profile the active file with py-spy and display the results |
Flamegraph: Load Profile |
Load a profile from a py-spy file. You may also right-click on .pyspy files in the file explorer and select Flamegraph: Load Profile. |
Flamegraph: Toggle Inline Profile |
Show or hide the inline annotations. This is also accessible via right-click on the editor. |
Flamegraph: Show |
Open a new tab showing the flamegraph |
Flamegraph: Attach py-spy to running process |
Attach py-spy to a running process and display the results. The extension will ask for a Process ID (PID) to attach to |
Flamegraph: Profile all unit tests with pytest |
Run and profile the pytest command |
Flamegraph: Profile unit tests in file with pytest |
Run and profile the pytest command on the active file |
Flamegraph: Show py-spy top |
Displays a top like view of functions consuming CPU using py-spy |
The extension allows you to run the py-spy profiler from VS Code's task system. This makes it easy to integrate profiling into your workflow and configure custom tasks.
- Open the Command Palette (
Ctrl+Shift+PorCmd+Shift+Pon macOS) - Type "Tasks: Run Task" and select "flamegraph"
- Choose one of the available flamegraph tasks or click the gear icon to customize the task.
You can also create a tasks.json file in your .vscode folder to customize the tasks. For example, the task
{
	"version": "2.0.0",
	"tasks": [
		{
			"type": "flamegraph",
			"file": "${file}",
			"args": [
				"--my-custom-arg1",
				"value",
			],
			"label": "Flamegraph: My custom profile command"
		}
	]
}
will execute the command
py-spy <py-spy-args> -- python <current-file> --my-custom-arg1 value.
Or, you can profile a specific unit test (via pytest) with the following task definition:
{
	"version": "2.0.0",
	"tasks": [
		{
			"type": "flamegraph",
			"args": [
				"-m",
				"pytest",
				"path/to/my_test_file.py::test_my_function",
			],
			"subprocesses": false,
			"native": true,
			"subprocesses": false,
			"gil": false,
			"idle": false,
			"nonblocking": false,
			"label": "Flamegraph: Profile my_test_function"
		}
	]
}
Notice that we additionally enabled the py-spy native option. This will execute the command
py-spy <py-spy-args> --native -- python -m pytest path/to/my_test_file.py::test_my_function
You can bind tasks to keyboard shortcuts by adding entries to your keybindings.json file:
- Open the Command Palette (
Ctrl+Shift+PorCmd+Shift+Pon macOS) - Type "Preferences: Open Keyboard Shortcuts (JSON)" and select it
- Add entries like the following:
{
    "key": "ctrl+shift+enter",
    "command": "workbench.action.tasks.runTask",
    "args": "Flamegraph: My custom profile command"
}- Clone the repository
git clone https://github.com/rafaelha/vscode-flamegraph.git- Install dependencies for both the extension and the flamegraph-react UI
npm run install:all- Build webview UI source code, i.e. the flamegraph react component
npm run build:webview- In VS Code, press
F5to open a new Extension Development Host window.
- Switch to
speedscopeformat. Eventually, this extension should be refactored to be compatible with all profilers that outputspeedscopefiles. Currently, only left-heavy profile view is supported. - Unit tests
- Performance tests
- Option to filter the flamegraph by module.
- Refactor flamegraph react component. Currently, the whole graph is recomputed on every mouse hover event. We could consider using
speedscopenpm package to render the flamegraph. - Search in flamegraph
- Profiling files without opening a workspace/folder. Currently, the extension requires a workspace/folder to be opened.
- Memray memory profiles
- Zoom animations in flamegraph
- Select sampling interval
- Jupyter notebook profiling.