This project aims to visualize the distribution of accumulated shadows for each season of the year across Chicago's street network. By presenting data through interactive map and chart visualizations, we seek to offer a comprehensive understanding of shadow patterns at the street segment level. The project incorporates multiple visualization techniques to showcase different aspects of the data, including geographic distribution and seasonal variations. Our goal is to create an accessible and informative tool for urban planners, researchers, and the general public to explore the impact of shadows on the urban environment.
- GitHub repo: https://github.com/komar41/street-network-shadow
- Tools used: Angular, TypeScript, Python, GeoPandas, Flask, D3.js, OpenLayers, HTML, CSS

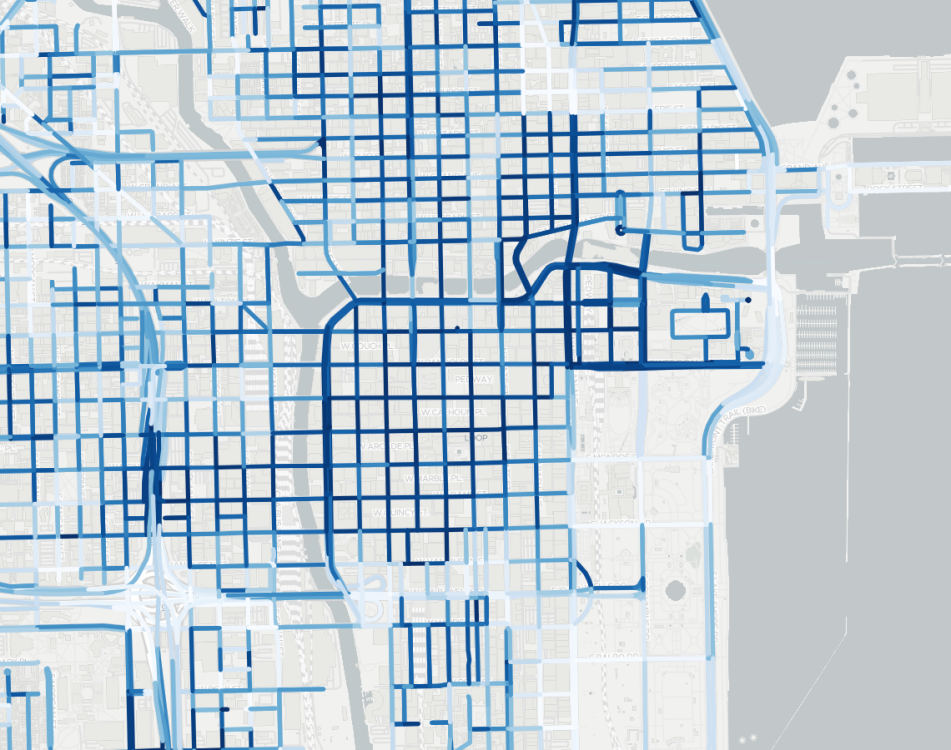
- Displays the street network of Chicago
- TileLayer for base map visualization
- Centered on Chicago coordinates
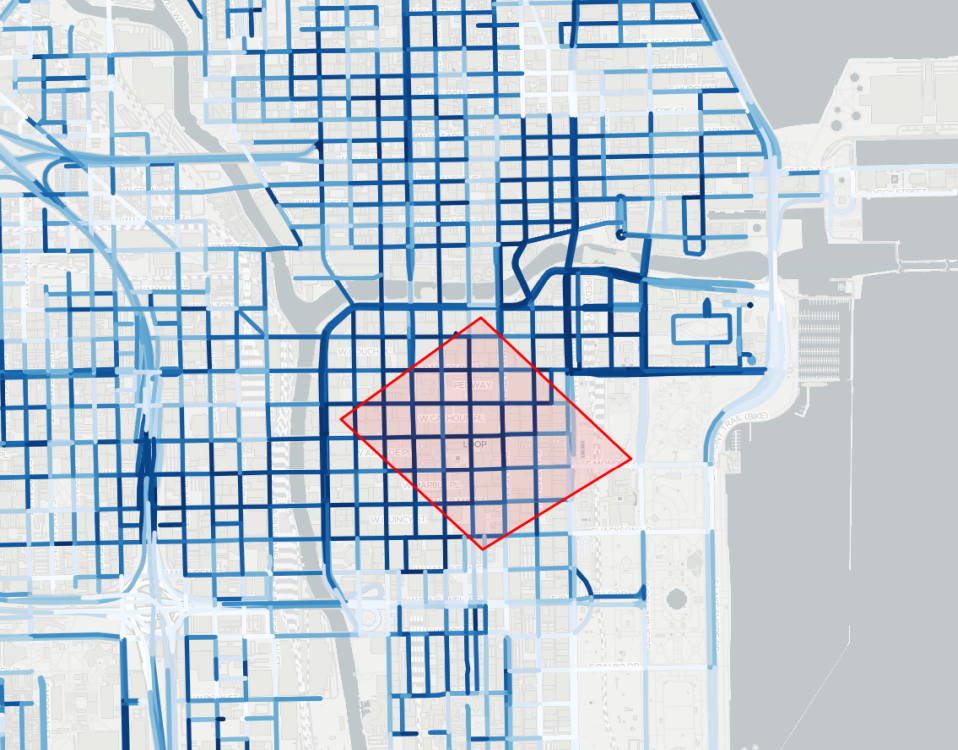
- Interactive selection functionality allowing users to draw and translate arbitrary polygons
- Visualizes the distribution of shadow values for all seasons
- Updates based on the user's polygon selection on the map
- Provides comparative view of shadow patterns across different seasons
- Draw arbitrary polygons on the map to select areas of interest
- Translate selected polygons to adjust the area of focus
- Dynamic updates of the distribution chart based on map selection
Download the datasets here, and find more information here and here.
- Accumulated shadow data for three key dates:
- June 21 (summer solstice)
- September 22 (autumnal equinox)
- December 21 (winter solstice)
- Shadow data aggregated at the street segment level
- Time range: 1.5 hours after sunrise to 1.5 hours before sunset
- Angular framework for component-based architecture
- D3.js for creating interactive data visualizations
- OpenLayers for map rendering and interactions
1. Front-end setup:
ng new vis
cd vis
ng generate component map
ng generate component chart
ng generate service data
npm install --save-dev d3 ol @types/d3 @types/ol
npm install
2. Back-end setup:
conda create --name geopandas
conda activate geopandas
conda install geopandas flask