GeoDEN (Geographic Dengue Exploration) is a visual exploration tool that empowers epidemiologists and researchers to investigate the spatiotemporal distribution, movement, and co-occurrence of dengue virus serotypes (DENV1–DENV4). This repository hosts the code and data used to build GeoDEN, as described in our paper published in Computer Graphics Forum.
By combining a map of reports with other visualizations and the power to select a specific place an time, GeoDEN enables the user find novel insights as well as verify known knowlege and events.
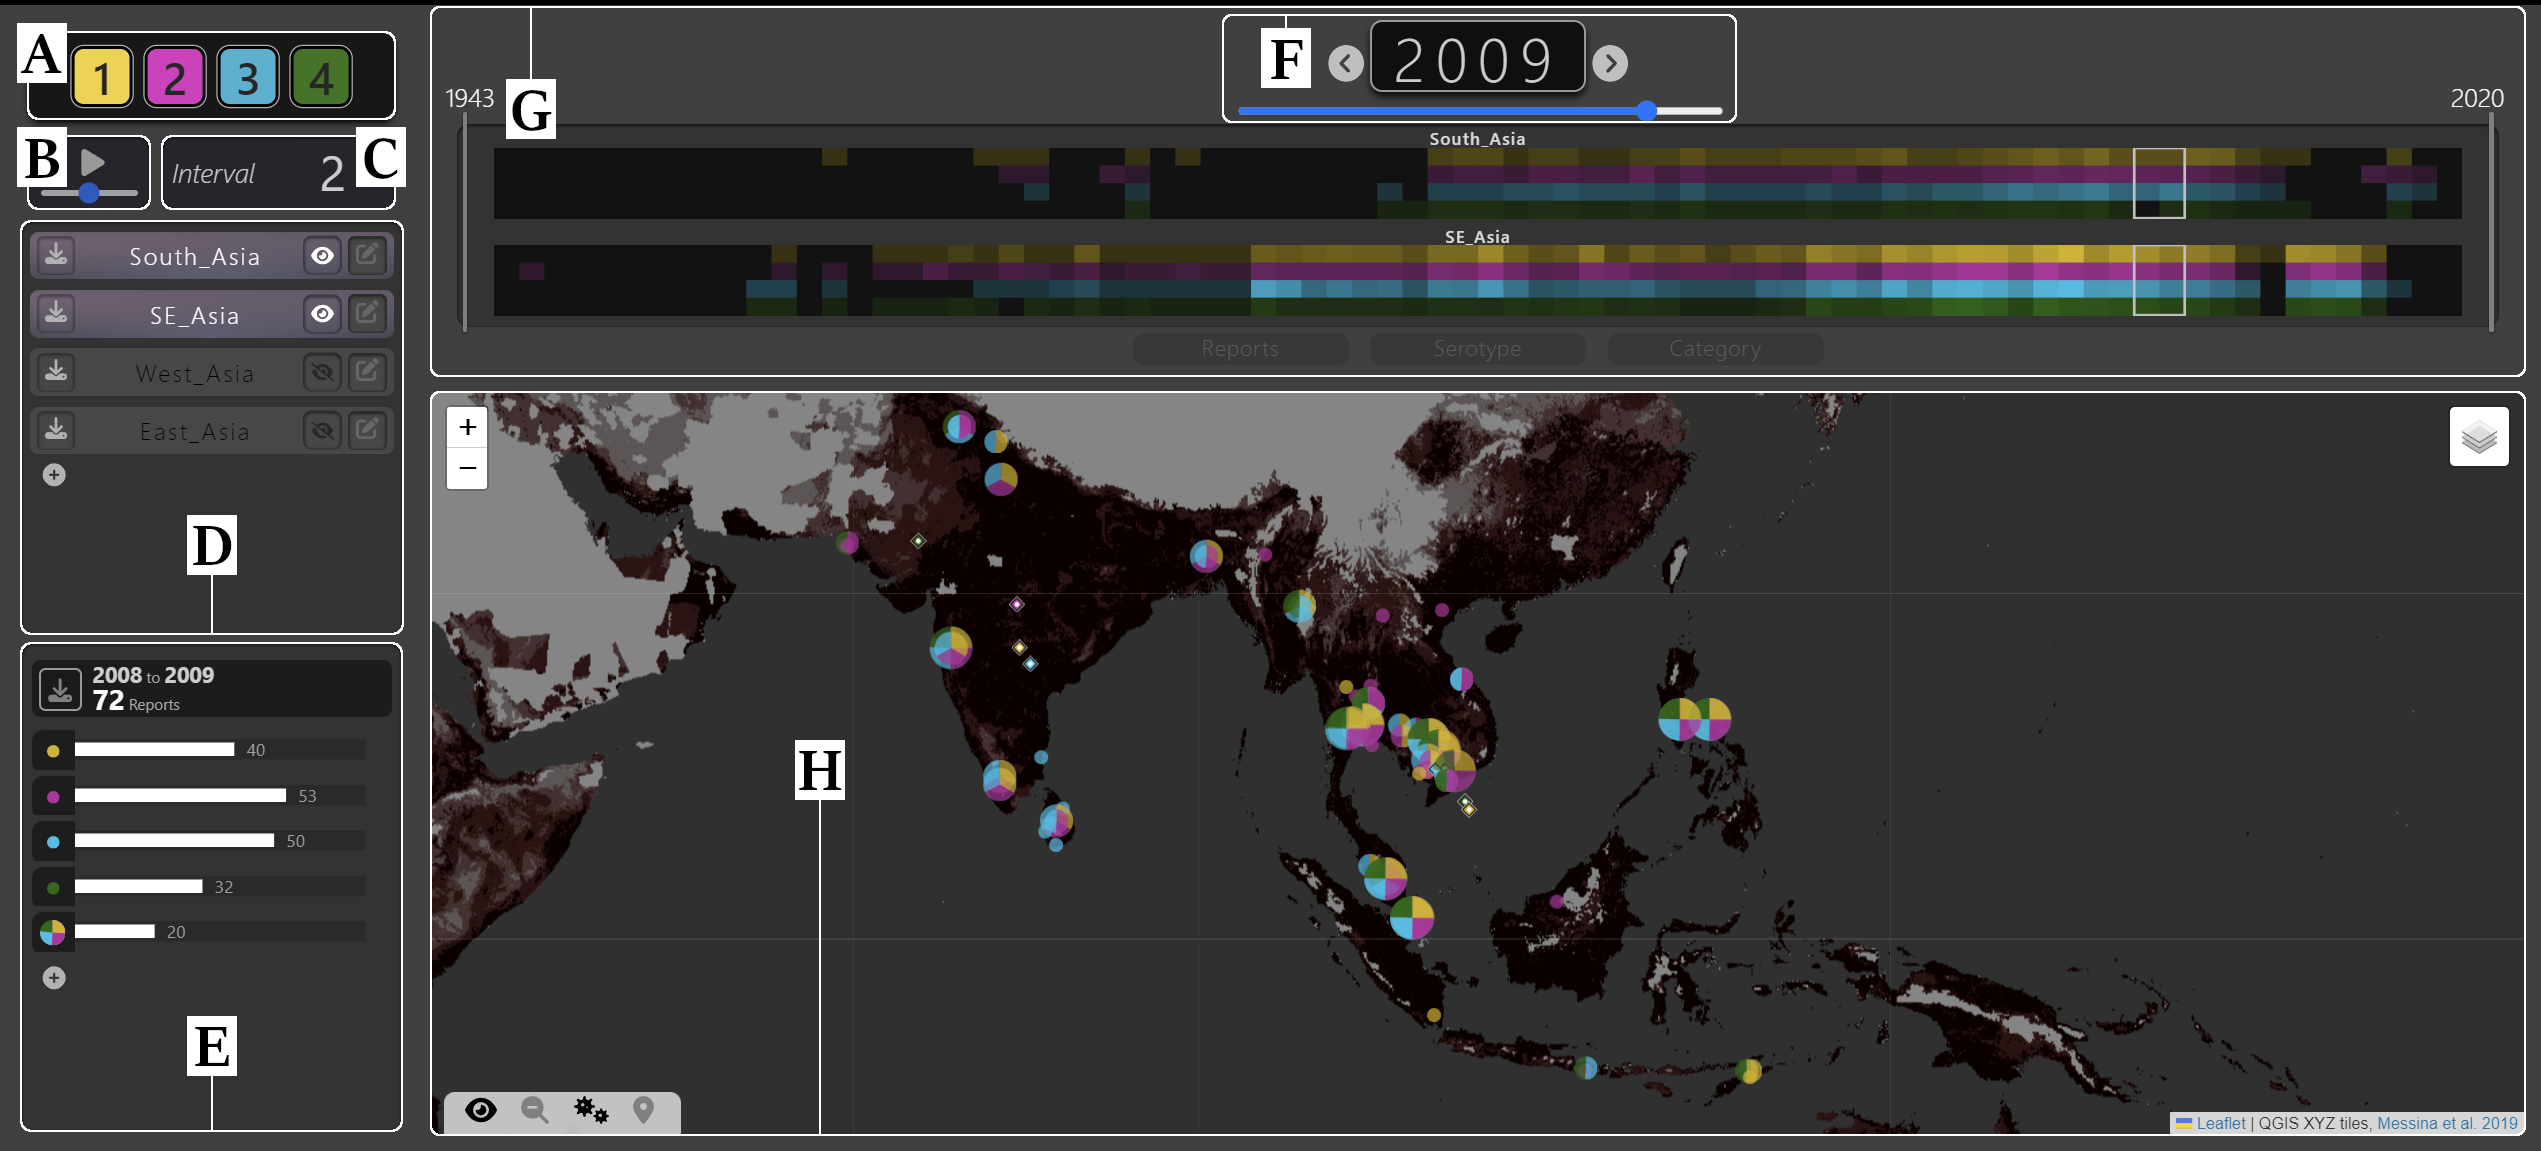
Figure
A. Serotype Selection: choose active serotypes.
B. Animation Controls: toggle and adjust animation speed.
C. Interval Length Editor: modify number of years visualized.
D. Region Faceting: define regions for visualization.
E. Co-Occurrence Histogram: examine frequency of serotype co-occurrence.
F. Year Editor: adjust the year.
G. Heatmap Timeline: compare regions and serotypes over time.
H. Map: view reports, centroids, trajectories, and environmental suitability.
- Serotype 1 is Yellow
- Serotype 2 is Pink
- Serotype 3 is Blue
- Serotype 4 is Green
Key features include:
- An interactive map that visualizes dengue reports by serotype over time, serotype clusters , and cluster trajectories .
- Timeline heatmaps and linked views for comparing different geographic regions and intervals.
- Animation controls that allow you to watch the progression of dengue reports across years.
- Co-occurrence histograms to investigate which serotypes appear together.
- Environmental suitability map overlay (optional) to see where dengue is expected to occur based on climate and demographic factors.
- Open the app in your local browser or online environment.
- Select serotypes of interest from the control panel.
- Define regions (or continents, countries) and filter the timeline.
- cluster the serotypes on the map or view trajectories.
- Animate through the years to see how serotypes spread or overlap.
- Use the co-occurrence histogram to see which serotypes frequently appear together.
- Region Faceting: Click on “Edit Regions” to group countries (or sub-continents) into user-defined regions.
- Timeline Heatmap: Drag on the heatmap to refine the date interval, or use the arrow keys to step forward/back in time.
- Animation: Press play/pause to animate year by year; adjust the speed slider as needed.
- Co-Occurrence: Check the bars to compare frequencies of single or multiple serotypes in the selected region/time range.
- Environmental Suitability: Toggle between a standard basemap and the environmental suitability overlay to see expected vs. reported dengue occurrence.
- Our Original Code is licensed under the MIT License.
- Third-Party Code or libraries retain their existing licenses (e.g., Apache 2.0). See LICENSE for details.
GeoDEN uses Messina et al. 2014's global dataset of reports for the years from 1943 - 2013.
A supplementary dataset has been added to fill in more recent data, and this covers the years 2014 - 2020.
In the future, we would like to fill out our data from 2011 - present.
GeoDEN also uses Messina et al. 2019's map of Aedes mosquito enironmental suitability, calculated using with data from 2015.
Dependencies:
(The citation information will be updated once the paper is published.)
BibTeX placeholder:
@article{YourPaperKey,
  title={GeoDEN: A Visual Exploration Tool for Analysing the Geographic Spread of Dengue Serotypes},
  author={...},
  journal={Computer Graphics Forum},
  volume={},
  number={},
  pages={},
  year={202X},
  publisher={Eurographics / Wiley},
  doi={...}
}
Please cite our paper if you use or modify this work in your own research projects.