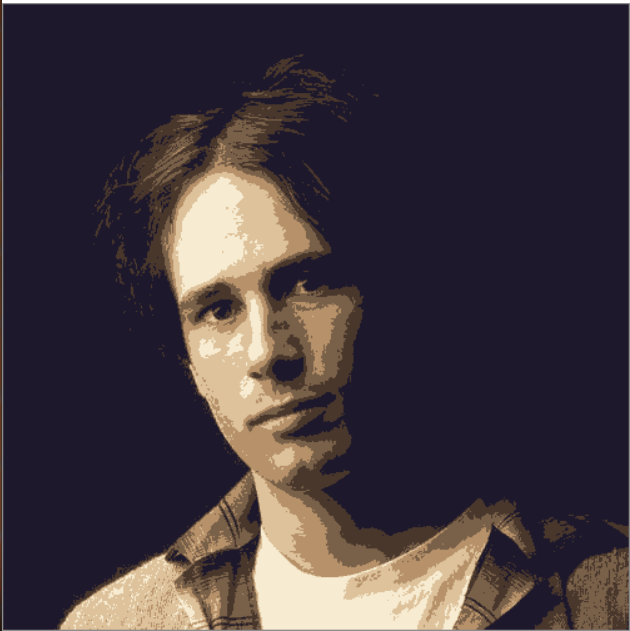
Image cartoonification using K-means-clustering
First, I have used K-Means++ to initialize the cluster centers. Then, the algorithm adjusts (recenters) the cluster centers n-times, to find the most accurate representative points.

Because we have used K-Means++, the number of times we have to recenter clusters, is significantly less, compared to a K-Means clustering algorithm. We also don't have to run the program a lot of times to find the best initialization points.
Then all pixels within a cluster center can be represented with the feature vector of the representative point, of that cluster. Which means we don't need to store the features of all pixels. This is how this algorithm can also be used to compresses images.
Note: This is not a loss-less compression algorithm. Data from the image is omitted to reduce the size.
An image can be thought of as a three dimensional grid with some height, width, and layers.
Where, height and width represent the portrait dimensions of the image, and layers represent the initensities of different colours.
A black and white image only has one layer, which represents the grayscale intensity values between 0 to 255. where 0 means black and 255 means white.

A coloured image may have multiple layers, with the most common format being RGB (Red Blue Green)

The intensity values are between 0 - 255 because that is the range of storage of one byte.
1 byte = 8 bits = pow( 2,8) = 256 number = 0 - 255
This means, size of pixels of a colored image is 3 bytes.
K-Means is an unsupervised pattern recognition algorithm. Which means it can itself identify similar feature data points and hence form clusters within the data set.
K number of representative points (one for each cluster), are randomly initialized by the user, which are adjusted by the K-Means algorithm to find near ideal representatives, for each cluster. These representative points are called centroids or cluster-centers.
After the formation of final clusters, we don't need to study individual data points. We can make conclusions about the data just by analysing representative points.
Randomly initializing centroids is fast, but it may badly impact the results. Thus we have a more sophesticated centroid initialization algorithm, called K-Means++.
STEPS
-
We initialize the first centroid randomly, from the set of available data points.
-
Then we calculate the difference in feature vector of each datapoint from the already established centroid(s), and then establish the point with maximum difference, as the next centroid.
We can find the ideal no. of clusters for an image, by conducting a Silhoutte Analysis, and comparing the Silhouette coefficient values.
This will help us compress the image, keeping both details of the image, and the weissman score high.
