Debugging the learning process
By: Ariel Faigon
The essence of Machine Learning is how to generalize well
Generalizing better and with more confidence is what distinguishes the best practitioners of the art from the average ones. Unfortunately, the quest for better models is mostly a black-art. In particular, there are no widely used "out-of-the-box" and easy to use tools to help ML practitioners design better models. This is one attempt to improve the situation.
The open-source project vowpal-wabbit (aka vw) now includes an easy to use utility called vw-top-errors (utl/vw-top-errors in the source tree). Its purpose is to help you design better models, models which generalize well.
The standard practice in machine learning is to focus on end results (average loss, accuracy, precision, recall, various AUCs, F-measure etc.). This practice completely overlooks the process by which a learner converges on the end results. I claim that the process matters. How the learner converges on the final result is no less important than the end-result.
Moreover, I'll try to show below, that insights gained from the learning process, can directly point to practical and simple ways to improve models and in some cases provide significant insights into what we're trying to learn.
vw-top-errors debugs the online learning process by pointing out unusual deviations from model convergence. In my experience, generalization errors (bad performance on unseen data) don't spring out of the blue. Often there are hints of problems and imperfections, albeit small, in earlier training. These little imperfections usually manifest in larger numbers and magnitude after models are deployed, so catching them early can help steer the learning process and models in the right direction: generalizing better.
There are many root causes of bad models. Among them:
- Bad feature selection (e.g. including noisy irrelevant features in the train-set)
- Bad feature engineering (feature encoding); a flaw in the process extracting or generating the features from initial data
- Pathological examples: outlier-valued features; other random erroneous values
- Incorrectly labeled examples
- Bad tuning: sub-optimal hyper-parameters used in the learning process leading to over or under fitting
- Non stationary data (data where the relation between the target and the input features changes over time)
The main goal of vw-top-errors is to help you efficiently pinpoint any of the above causes. vw-top-errors shines a light on the data-set examples (rows) and features (columns) that are most adverse to model convergence. These adversarial data-points may become even more common and pronounced after model deployment. You may view, vw-top-errors as an "online learning anomaly detector" (Credit: Ben Gimpert).
Over-fitting is a very common problem in machine learning practice. The problem is that over-fitting is mostly recognized after the fact e.g. when after model deployment results turn-out to be much worse than expected. Using vw in combination of vw-top-errors, we can proactively induce over-fitting, without making any change to our data-sets. This enables us to detect issues that would otherwise go unnoticed. This method is similar to stress-testing of software and can help us change our models so they are more immune to over-fitting.
In this example, we use a spam/ham binary classification data-set. The blue and red lines both show progressive mean-loss over the learning sequence. power_t is a vw learning parameter which controls how fast the learner is allowed to forget the past. The difference between the blue and red lines is in the value of the power_t parameter passed to the vowpal-wabbit learner. To stimulate over-fitting, we simply ratchet --power_t up from the default 0.5, to 0.9. As a result, learning is heavily biased towards over-weighting old examples and not adapting to the realities of new data. In other words, by the extreme choice of the --power_t parameter, while leaving the data-set as is, the learner is forced to not generalize well.
At some point during learning, a feature that was found mostly in spam-messages -- and thus was considered "spammy" -- started appearing mostly in ham-messages. This contradicted what the model has learned so far. Unfortunately, because the model has already significantly converged at that point, and was "set in stone", refusing to unlearn what it already learned, it caused the learning process to proceed in reverse direction and diverge to very high loss-values. In the chart below, the 1-28 progress range on the X-axis scale can be assumed to be our training set, and the rest, our test-set. What we have is a typical case of over-fitting. The training error is very low, while the test error is very high. This example demonstrates what often goes wrong when practicing ML.

Examining the --power_t 0.9 learning process with vw-top-errors immediately points to the exact example number & feature where learning starts going haywire, allowing the user to realize the problem and fix the issue. The result is the red-line showing a smooth loss convergence with no surprises.
In this particular case, the (auto-generated) feature which threw the learning off-course was a particular HTML tag <font face="Verdana" ...>. This feature ranked as the most adverse input feature. It is now obvious that such HTML tag is a noisy/irrelevant feature which may appear both in spams and hams. It simply happened to be more frequent in spam (vs ham) examples at the beginning of our train-set. This insight makes us decide to delete it from the training-set. This simple action leads to smoother convergence, less unexpected surprises, and better generalization error. The deployed model, after the small necessary adjustment, avoids potential future issues of a similar nature.
Here's the critical insight: the technique shown above is a general and practical way to improve models. By deliberately stretching --power_t till the point of no-return is reached, we can force our models to break at will at their most vulnerable seams. The technique can be applied on any real-life data-set in order to uncover its most critical vulnerabilities with good probability. improving models by stress-testing them to the point of breaking them should be a standard tool in any ML practitioner toolbox.
Here's another example of how useful debugging the learning process can be. A usefulness that transcends the technique of induced over-fitting.
We run vw-top-errors (without applying any stress-test related option) on a stock-market (ETF) dataset file called f5-252-tt.gz. This data-set has over 70,000 examples spanning about 300 ETFs over the course of about 1 year. The label encodes a future N-day return. You may find a similar data-set, (albeit older, and less clean) in the vw source tree at: test/train-sets/0002.dat. Also note that stock market data is highly random, chaotic, and non-stationary.
The 4 and 3 arguments are optional. 4 is the number of (top N deviant) examples we want to look into, and 3 is the number of top-weighted features in these top examples which we would like to inspect. They are used here for the sake of output brevity.
$ vw-top-errors 4 3 vw --loss_function quantile -d f5-252.tt.gz
=== Top-4 (highest delta loss) diverging examples:
Example Relative-Loss
30967   21.5704
58327   20.8697
57757   19.9887
58042   17.7533

=== Top-weighting underlying 3 features @ diverging examples:
Example #30967: 0.528995 INDL/20131105
        Feature     Weight      Full-audit-data
        f^t40       -5.032010   f^t40:99972:0.0257327:-5.03201@1.03845
        f^t20       -1.160900   f^t20:118619:0.0135414:-1.1609@2.40879
        Constant    0.495626    Constant:116060:1:0.495626@7741.5
Example #57757: 0.428085 INDL/20140324
        Feature     Weight      Full-audit-data
        f^t40       -8.437000   f^t40:99972:0.0269477:-8.437@1.54794
        f^t10       -0.515675   f^t10:218947:-0.000253052:-0.515675@7.2235
        Constant    0.511259    Constant:116060:1:0.511259@14439
Example #58042: 0.404529 INDL/20140325
        Feature     Weight      Full-audit-data
        f^t40       -8.052660   f^t40:99972:0.0290388:-8.05266@1.55699
        Constant    0.513600    Constant:116060:1:0.5136@14510.2
        f^t10       -0.468303   f^t10:218947:0.0234809:-0.468303@7.23304
Example #58327: 0.392283 INDL/20140326
        Feature     Weight      Full-audit-data
        f^t40       -7.827710   f^t40:99972:0.0307578:-7.82771@1.56562
        Constant    0.512523    Constant:116060:1:0.512523@14581.5
        f^t10       -0.424944   f^t10:218947:0.0433757:-0.424944@7.24839

=== Top adverse features (in descending mean weight)
Name                Mean-Weight  Examples
f^t40               7.337345     30967 58327 58042 57757
f^t20               1.160900     30967
Constant            0.508252     58042 58327 57757 30967
f^t10               0.469641     58327 58042 57757
Generally, the largest errors happen close to the beginning of training, before the model had a chance to converge. vw-top-errors compensates for this by looking at the relative error (since_last_loss / average_loss). This particular data-set has over 70,000 examples. Somewhat to our surprise, the biggest relative errors happen to be after the 50,000 examples mark, when the overall mean loss has already converged to a small value and the learning rate has decayed significantly. Spikes near the end of learning are usually an indication of a real change in data (non-stationary conditions). Non-stationarity is the temporal cousin of over-fitting. Over-fitting and non-stationarity are two sides of the same coin.
All 4 examples in this output (out of ~70,000) captured by vw-top-errors make the average loss spike in an unusual way. In this case the relative error of each spike is about 20x of the average error. Looking into these examples helps makes sense of the spikes. All 4 anomalous examples have INDL as the ETF symbol. INDL is a Direxion family, India ETF which is very volatile due to its leverage. 3 of the 4 dates in which large anomalies occur, are consecutive (March 24-26, 2014). Could it be that we have some bad data for INDL for these few dates in March 2014? Checking the data refutes this hypothesis: the data looks correct - and consistent - across sources. Looking at the INDL chart around March 24-26 reveals something entirely different. It seems like there has been some news (or more likely: early poll results) that affected the India stock market. This news made the INDL ETF break out of its range (and downward monthly channel) in an unusual/extreme way. We now know (but may have not realized then), that India's political landscape was about to change in a dramatic way with the landslide victory of Narendra Modi in India's general elections in mid May 2014.
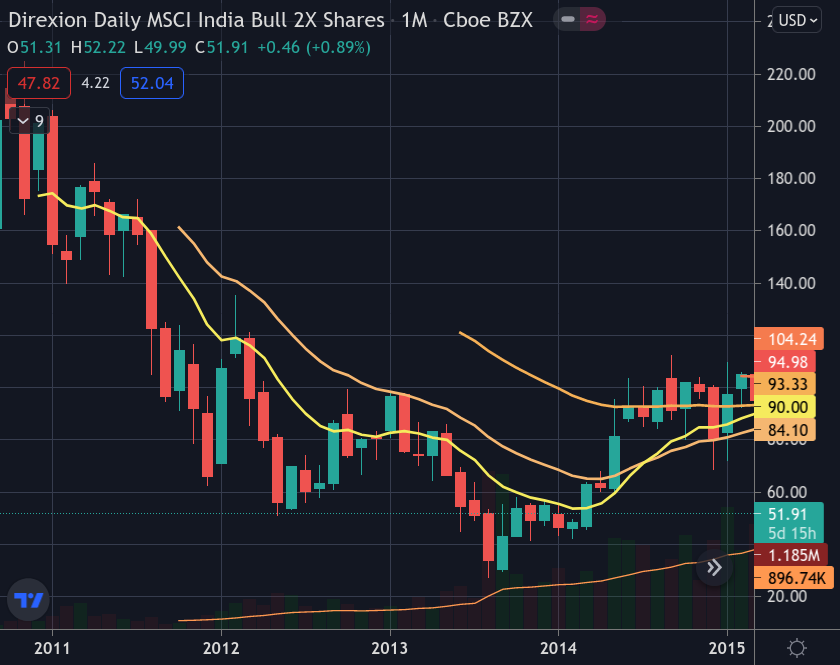
The INDL breakout detected by vw-top-errors had turned out to be a genuine precursor to a much larger move up, about a month and a half later, once the new India political reality became a broader common knowledge.
Further drilling into the feature-level, we can see that one feature in the learned model f^t40 stands head and shoulders above the rest in importance. f^t40 is the #1 suspect for the loss increases. Knowing our data-set we figure than the 40-day trend of INDL has been broken. The India stock market seems to have switched from a long or intermediate down-trend, to an up-trend.
Perhaps even more intriguing, is the fact that the first notable error spike in INDL was detected over 4 months earlier, in Nov 2013 (2013-11-05). It was an early precursor for the final 3-day anomaly breakout confirmation in March 2014.
So, in this particular case, unlike in the spam example above, we have a genuine, and notable, case of non-stationary data, which we don't want to discount.
This is exactly what vw-top-errors was designed for. It tells us what "doesn't look normal", and by extension what should we look into. If the data, or our feature choices, are bad - we can fix them. If the changes are genuine and meaningful, we can try to further understand why - leading us to new and significant insights.
After inspection and investigation, we may decide to stop including leveraged ETFs in the data-set, because of their unusual adverse effect on modeling, or we may decide to leave them in, and start paying special attention to their genuine break-outs or break-downs. Such early break-outs or break-downs after prolonged trends, seem to precede much larger moves in sectors or country ETFs.
Whatever we decide to do, vw-top-errors helped us gain a quick insight into the causes of unusual "bumps" in the online learning process. These "bumps" are early and notable manifestations of models failing to generalize.
- Debugging data (and models) is considered a "black-art" (See Pedro Domingos' A few useful Things to know about Machine Learning)
- Many types of models, especially those with a very large number of input features tend to be opaque and have little or no human-level explanatory basis
- There's a dearth of literature on the practice of how to "debug data", and by extension how to create better models
- Outside of the very generic "data visualization" approach, there are no simple to use ML debugging tools I'm aware of.
- There's a grave need for standard tools which can assess model quality beyond end-performance results.
- Machine learning practitioners tend to focus on the end results (AUC, Accuracy, Precision, Recall, F2 measure, Test loss) rather than on small issues in the process of learning
- Machine learning practitioners use a lot of trial-and-error -- to see how it affects the end result -- as opposed to a focused approach to debugging data by finding the core causes of model imperfection
- Generalization error is generally viewed as a fait-accompli, and models are usually viewed as imperfect (which is true) but this leads to a defeatist as-is acceptance of models even though they can be easily further improved.
- Online learning presents a unique opportunity to probe deep into the learning process instance by instance to gain insight into the imperfections that are inherent in the model
- Generalization errors rarely appear out of the blue. Often they are preceded by similar "dissenting examples" in the training set.
- These dissenting examples appear as bumps (slight disagreements with the current model) on the training loss convergence chart.
- Notable dissenting examples may indicate earlier over-fitting, or something specific, and very interesting in the data. These points of dissent are worth investigating and pursuing, rather than dismissed as "noise".
- Restricting learning decay-rates (deliberate use of a too-high
--power_tvalue) is an easy and widely applicable technique for breaking models at will, thereby uncovering the weakest and most questionable features of the model. Anomaly detection can lead to effective feature-selection. -
vw-top-errorscan help debug data and improve models by pin-pointing bumps and imperfections in the training process, as well as pointing at the features which cause them. These features may be good and genuine (lone dissenters that should, nevertheless, be considered), a real shift in regime (non-stationary data), or bona-fide bugs in feature selection, encoding, or the data itself.
In the end, it is generalization that counts. vw-top-errors can show us the way towards better generalization and provide us with new insights.
To use vw-top-errors simply prepend vw-top-errors to your regular vw training command. For example:
vw-top-errors ... vw ... training-set-file
where ... represent optional options and parameters passed to vw-top-errors and the learner vw respectively.
vw-top-errors runs two training passes:
The 1st pass looks at the largest N deviations in loss convergence. Those top N examples which make the loss jump in unexpected ways, are recorded.
In the 2nd pass, vw-top-errors audits the learning process with -a (audit) to single out the notable features in the deviant examples it captured in the 1st pass.
Calling vw-top-errors without any arguments, prints a detailed usage message.
$ vw-top-errors
Expecting a 'vw' argument followed by training-args
Usage: vw-top-errors [options] [args] vw <vw-training-arguments>...

    Will run 2 passes:
    1) Learning with --progress 1: catch the biggest errors
    2) Learning with --audit: intercept the biggest errors
       and print their highest weights.

    vw-top-errors options (must precede the 'vw' and its args):
        -s      Use sum-of-weights instead of mean-of-weights
                in 'top adverse features' summary
        -v      verbose

    vw-top-errors args (optional, must precede the 'vw' and its args):
        <TopN>          Integer: how many (top error) examples to print
                        (Default: 5)
        <TopWeights>    Integer: how many top weights to print for each
                        (top error) example
                        (Default: 10)