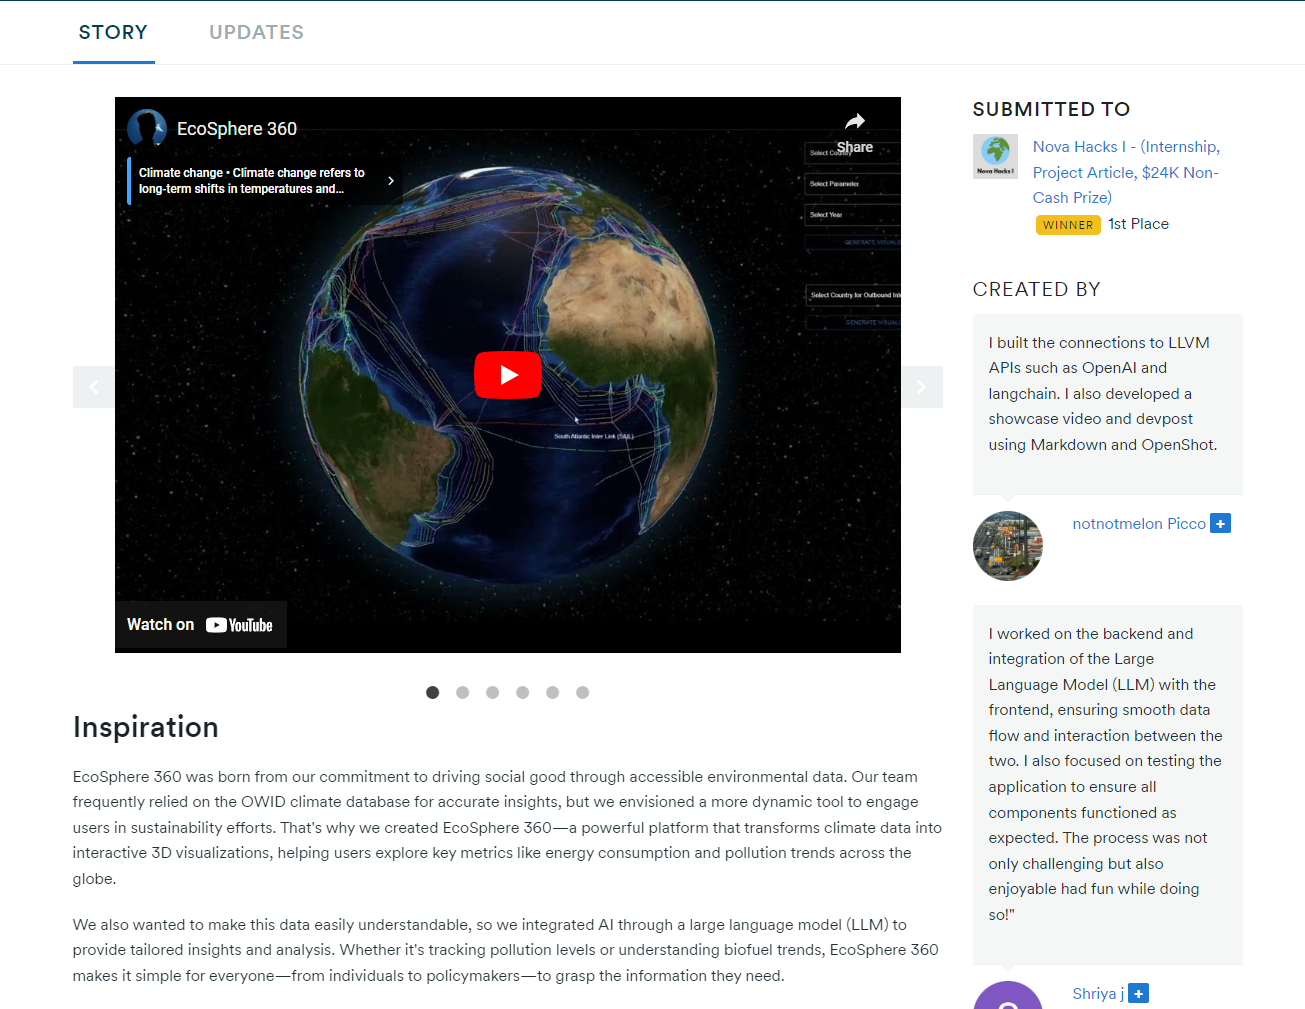
Our project is dedicated to social good. We believe being informed is the most important step towards sustainability. Our team has frequently used the OWIS database climate database for accurate information, but soon realized that this database would be improved with a powerful 3D visualization tool. We also wanted to leverage the power of AI and large language models. That's why we invented EcoSphere 360!
Screen.Recording.2024-10-17.191455.mp4
- EcoSphere 360 visualizes data from the OWIS database.
- Interact with an intelligent AI LLM to instantly parse and find information in this database through a process known as the
AgentExecutor. - Immerse yourself in the real-time 3D globe graphics powered by node.js and 3js.
- Find sustainability information over time and track hundreds of metrics such as energy usage, biofuel increase per capita, and many more!
Our project uses Node.js and React for the frontend. We rely on the following javascript libraries to aid in the 3D rendering process.
npm install react-globe.gl@1.0.4
npm install three
npm install tailwindcss postcss autoprefixer
npm install postcss-cli
npm install csv-parser
npm install @mui/material @emotion/react @emotion/styled
npm install @mui/icons-material
npm install geojson
npm install d3
Our project uses Python for the server-side backend.
We use CSV parsing libraries pandas and numpy.
We also use the Python libraries langchain and OpenAI to invoke and train our LLM.
 make a new file named openai_api_key as above make a same name function and paste it for LLM to work in real time.
LLM_DEMO.mp4
Our team encountered countless challenges while developing our software. However we believe in overcoming adversity and were able to solve all the technical issues through teamwork and hard work.
One major challenge we ran into was how to train and execute our LLM in real time.
We wanted our tool to be able to parse the database efficiency and return the most accurate data.
After trying many options, we eventually settled on a solution involving a chain of "thoughts". Each thought invokes some pandas command on the database which incrementally refines the output through a process called the AgentExecutor.
Here is an example output of that process run on the prompt: Which country has the most growth in biofuel in 2019?
> Entering new AgentExecutor chain...
Thought: First, we need to filter the dataframe to only include data from 2019. Then we can sort the dataframe by the biofuel consumption change percentage in descending order.
Action: python_repl_ast
Action Input: df[df['Year']==2019].sort_values(by='biofuel_cons_change_pct', ascending=False)              Country  Year iso_code   population  ...  wind_consumption  wind_electricity  wind_share_elec  wind_share_energy
19910         Ukraine  2019      UKR   44211100.0  ...             5.325              2.24            1.465              0.556
4981          Croatia  2019      HRV    4129749.0  ...             3.868              1.47           11.611              4.037
9339        Indonesia  2019      IDN  269582880.0  ...             1.276              0.48            0.162              0.056
6299          Estonia  2019      EST    1327039.0  ...             1.811              0.69            9.067              2.885
11484        Malaysia  2019      MYS   32804024.0  ...             0.000              0.00            0.000              0.000
...               ...   ...      ...          ...  ...               ...               ...              ...                ...
20892         Vietnam  2019      VNM   95776712.0  ...             1.903              0.72            0.317              0.158
21083  Western Sahara  2019      ESH     544883.0  ...               NaN              0.00              NaN                NaN
21248           Yemen  2019      YEM   31546694.0  ...               NaN              0.00            0.000                NaN
21463          Zambia  2019      ZMB   18380478.0  ...               NaN              0.00            0.000                NaN
21586        Zimbabwe  2019      ZWE   15354606.0  ...               NaN              0.00            0.000                NaN

[221 rows x 101 columns] Now we can see that Ukraine had the highest biofuel consumption change percentage in 2019.We are extremely proud that our 3d render runs in real time in the web browser. Our team had a heavy focus on web performance and optimizations. The end product is extremely smooth and responsive, even on low end devices.
Here are some examples of the visualizations possible with EcoSphere 360:
Globe.Visualizations.mp4
Our team is also dedicated to open source/OSS software. This project is licensed under a copyleft MIT license meaning its free to remix and build upon by the entire developer community.
This project was a huge learning opportunity for everyone involved. At the start of this project, no members of the team were familiar with AI programming. However at the end we learned the latest cutting-edge AI algorithms such as Neural Networks, AgentExecutor, and the attention mechanism.
On the frontend side, our team learned tons of new things about web rendering in 3D and performance optimizations. Early versions of this project had huge performance issues and each visualization could take up to 15 minutes to generate. We are pleased to announce that the final versions of this project have the capability to instantly execute and create beautiful visualizations.
Our future plan with this project is to host a free website dedicated to globe visualization, offering comprehensive insights into environmental data. We aim to include real-time air traffic data and air pollution trails to better understand how human activities impact the atmosphere. Additionally, we plan to incorporate new parameters and extend our dataset for enhanced and dynamic visualizations.
This tool will be a one-stop shop for all data related to climate change and global warming. Users will have the option to visualize data through various methods, such as choropleth maps, link diagrams, and more, based on their input. One of our key features will include real-time cloud movement integrated into the 3D model for accurate climate tracking.
Overall, our goal with this project is to create a comprehensive platform where users can visualize the many ways our daily activities impact Earth, providing them with a powerful tool to explore and understand environmental data in an accessible and meaningful way.
-
Clone the repo
git clone https://github.com/Umarocks/NovaHacks-I -
Activate the python venv on the command line.
Windows:./server/langchain-llvm/Scripts/activate
Linux:source venv ./server/langchain-llvm/bin/activate -
Edit the
open_api_key.pyfile on the toplevel directory: Please contact me for the key.
def get_keys():
return "<YOUR API KEY HERE>"-
Install all needed dependencies from the
dependencies.txtfile in NovaHacks-I/app/. -
Execute the application
python ./server/langchain-llvm/main.py